Climate - Senior phase
Greenhouse-gas emissions are causing an increase in the Earth's temperature, and consequent alterations in weather patterns.
The way we live is causing this rapid change in our climate. The industries and processes we rely on are the main source of greenhouse-gas emissions, which are causing an increase in the Earth's temperature, and consequent alterations in weather patterns. We also need to prepare for the climate change that we cannot avoid because of our previous emissions, which have set us on course for a changing climate.
Data
Scotland’s climate trends
What is the average temperature, rainfall or sunshine in my part of Scotland? The Climate Trends application below allows you to change the range of years and region. You can also use it to find out how Scotland’s growing season has changed over the years.
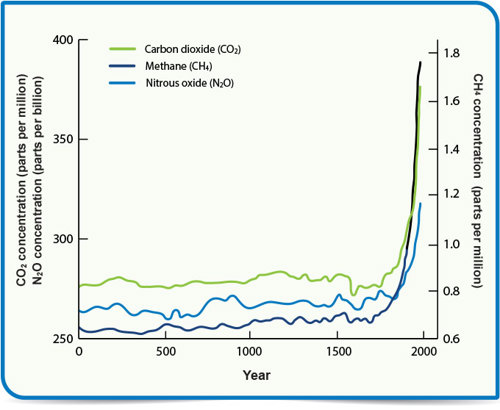
Atmospheric concentrations of important greenhouse gases
How have greenhouse gases changed over history? This graph shows an increase since 1750 when industrial activities began.
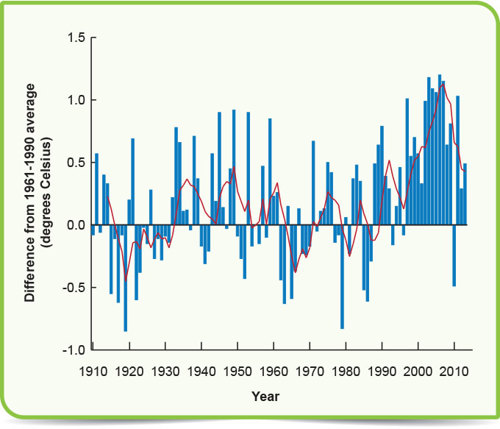
How has Scotland’s average surface temperature differed from the 1960-1990 average over the past hundred years?
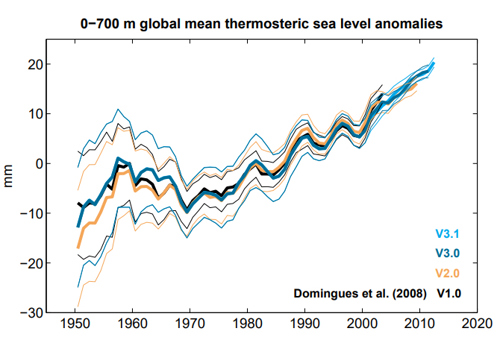
Global sea level variations since 1960
Review the CSIRO Marine and Atmosphere Research (PDF) - Can you explain these changes? What might have caused them?
Temperature, sunshine and rainfall data sets are available for download from the Met Office
A variety of download options are available including monthly, seasonal and annual values. Files can be downloaded in rank of year order.
Information about pathogens and tree-pests that may be influenced by climate change.
Read more about resilience indicators and how tree-pests and pathogens may be influenced by climate change.
Maps
Climate change and a rapid increase in tree pests and pathogens
Use the map below to investigate a rapid increase in the number of tree pests and pathogens these last few decades, and consider why climate change is likely to lead to changes in both their distribution and impact.

Apps
Met Office weather forecast app
Use the Met Office app to find out about weather in your area
NASA Images of change gallery
NASA's Images of Change gallery - NASA's Images of Change gallery features images of different locations on planet Earth, showing change over time periods ranging from centuries to days.
Met Office Weather Observation Website Survey (WOW)
The Met Office Weather Observation Website Survey (WOW) allows anyone to submit their own weather data, anywhere in the world. Can you identify the clouds you see? Can you record the wind speed?
Old Weather Survey
Get involved with analysing climate change data. The Old Weather Survey helps scientists recover Arctic and worldwide weather observations made by United States ships since the mid-19th century by transcribing ships' logs. These transcriptions will contribute to climate model projections and will improve knowledge of past environmental conditions.
Cyclone Centre
Patterns in storms imagery are best recognised by the human eye, The Cyclone Centre needs your help analysing these storms.
Resources
What is the greenhouse effect?
Find out more about the greenhouse effect from this State of the UK climate diagram.

Pages we suggest
- Our environment
- Get involved
- Video
Useful external links
- NOAA: Arctic program
- Defra: Biodiversity and climate change
- SEPA & Centre for Ecology & Hydrology: Choosing and using citizen science
- TCV: Citizen science - a guide for teachers
- Education Scotland: Citizen science & curriculum for excellence
- Natural History Museum & Biological Records Centre: Guide to citizen science
- NASA: Climate change and global warming video
- Met Office: Learn about the weather
- Met Office: UK regional climates
- Education Scotland: Weather and climate change